7 Data-Driven Insights to Understand User Behavior Analytics
To understand user behavior analytics, businesses must go beyond traffic numbers and focus on why users act the way they do. Website visits alone do not generate revenue, understanding intent, friction, and decision patterns does.
Many companies invest heavily in marketing but struggle with conversions because they lack visibility into real user interactions. Modern analytics reveals not just what happened, but why it happened.
This guide explains how to understand user behavior analytics, uncover hidden opportunities, and turn website visitors into customers.
What Does It Mean to Understand User Behavior Analytics?
To understand user behavior analytics means analyzing how visitors interact with your website, including:
- Click patterns
- Navigation paths
- Scroll depth
- Engagement behavior
- Drop-off points
Unlike traditional analytics tools that show traffic volume, behavioral analytics focuses on human decision-making.
Why It Matters
Businesses that properly understand behavioral signals can:
- Increase conversion rates
- Improve customer experience
- Reduce bounce rates
- Identify usability issues early
Why Is It Important to Understand User Behavior Analytics?
Understanding users helps answer critical growth questions:
- Why do users abandon checkout?
- Why do landing pages fail?
Why does traffic not convert?
When organizations understand user behavior analytics, they move from guessing to evidence-based decision making.
Key Business Benefits
- Better marketing ROI
- Faster product optimization
- Stronger customer retention
- Data-driven UX decisions
The 7 Core Methods to Understand User Behavior Analytics
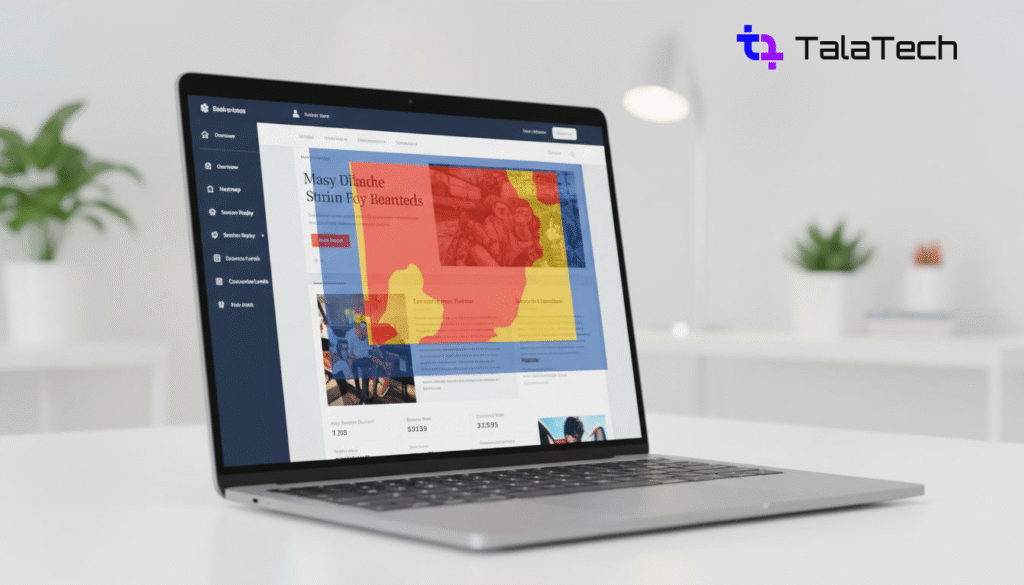
1. Heatmap Analysis
Heatmaps visualize where users click, move, and scroll.
They reveal:
- Ignored CTAs
- Distracting elements
- Content engagement zones
Hotjar provides behavioral visualization tools widely used across US companies.
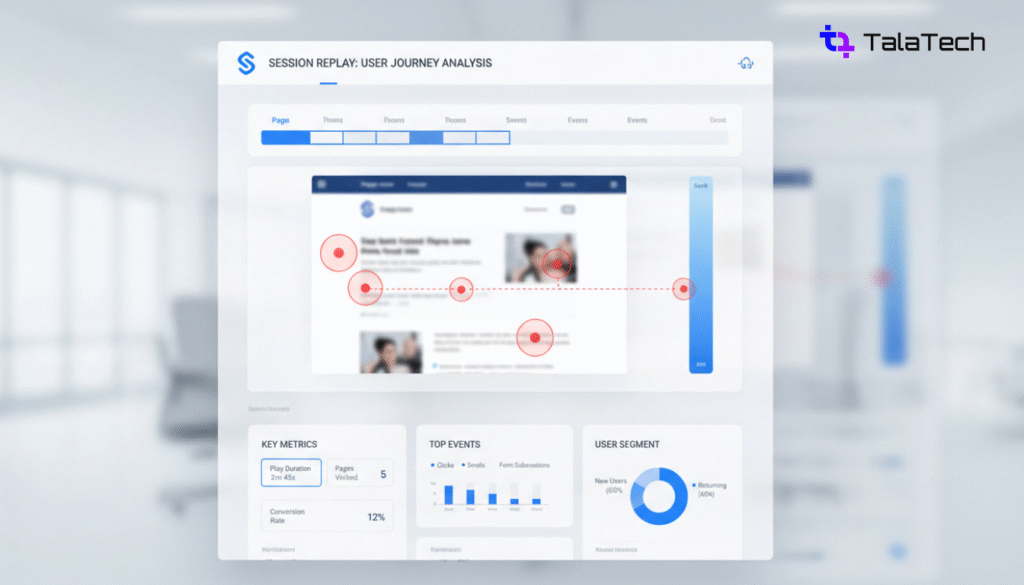
2. Session Recordings
Session recordings allow teams to watch real user journeys.
You can see:
- hesitation
- confusion
- rage clicks
- navigation struggles
This helps teams deeply understand user behavior analytics beyond dashboards.
3. Funnel Analysis
Funnels identify exactly where users drop off.
Common examples:
- Signup funnels
- Checkout funnels
- Lead generation flows
Businesses that understand funnel behavior typically improve conversions faster.
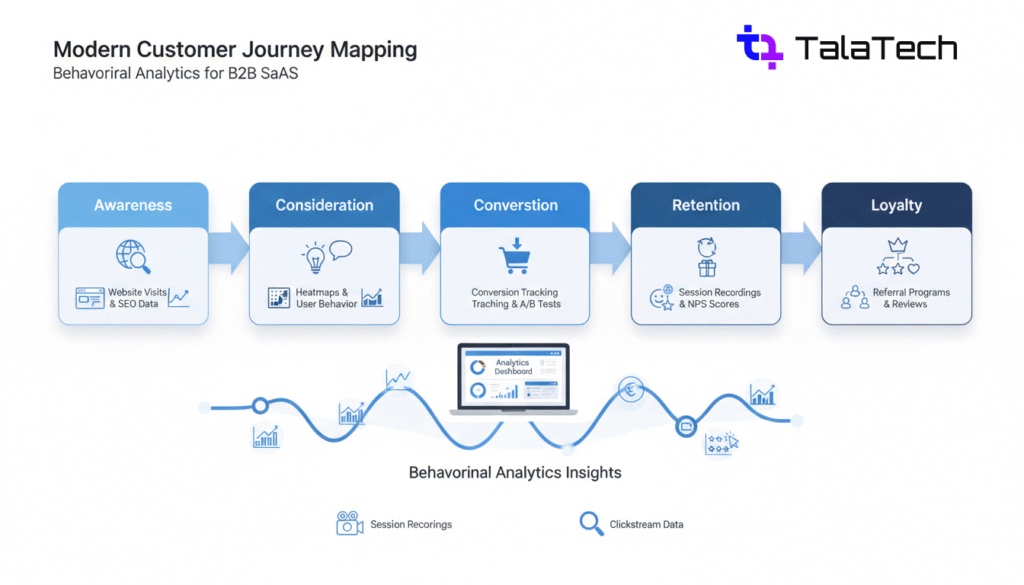
4. Customer Journey Mapping
Journey mapping connects multiple touchpoints into one experience.
You begin to understand user behavior analytics across:
- ads
- landing pages
- product usage
- retention stages
5. Event Tracking
Event tracking measures specific actions such as:
- Button clicks
- Video engagement
- Form interactions
- Feature usage
Tools like Google Analytics help monitor these behaviors at scale
6. User Feedback & Surveys
Behavioral data tells what users do. Feedback tells why.
Combine analytics with:
- exit surveys
- satisfaction scores
- usability testing
This combination helps teams fully understand user behavior analytics.
7. Behavioral Segmentation
Not all visitors behave the same.
Segment users by:
- new vs returning
- device type
- traffic source
- engagement level
Segmentation reveals hidden growth opportunities.
What Tools Help You Understand User Behavior Analytics?
Popular Behavioral Analytics Tools
- Heatmap platforms
- Session replay tools
- Product analytics systems
- Experimentation platforms
Leading UX research from Baymard Institute confirms behavioral testing significantly reduces abandonment rates.
Common Mistakes Businesses Make
Even data-driven teams struggle when they:
- Focus only on traffic metrics
- Ignore qualitative insights
- Track too many metrics without strategy
- Fail to act on analytics findings
To truly understand user behavior analytics, insights must lead to experimentation and optimization.
How to Understand User Behavior Analytics for Higher Conversions
Step-by-Step Process
- Define conversion goals
- Track meaningful events
- Analyze behavioral patterns
- Identify friction points
- Run experiments
- Measure improvement
Organizations that consistently follow this cycle outperform competitors.
How Do You Know If Your Website Has Behavioral Problems?
If you see high traffic but low conversions, your behavioral insights are incomplete.
Signs include:
- High bounce rates
- Low engagement time
- Abandoned forms
- Confusing navigation
These are signals you need deeper behavioral analytics.
How Often Should Businesses Analyze User Behavior?
Continuously.
User expectations evolve rapidly. US companies now treat behavioral analytics as an ongoing growth system rather than a one-time audit.
Can Small Businesses Understand User Behavior Analytics?
Yes.
Modern analytics tools make behavioral insights accessible even for small teams.
The key difference between growing companies and stagnant ones is not budget, it is how effectively they understand user behavior analytics and act on insights.
Future Trends in Behavioral Analytics
Emerging trends include:
- AI-driven behavior prediction
- Real-time personalization
- Predictive UX optimization
- Automated experimentation
Generative AI search increasingly favors brands demonstrating deep expertise and original insight, making behavioral analytics content critical for visibility.
Work With Talatech — Turn Insights Into Growth
At Talatech, we help US businesses move beyond surface-level metrics.
Our Conversion Intelligence approach helps companies:
- Understand real user behavior
- Discover hidden revenue leaks
- Improve UX decisions
- Increase conversions sustainably
Our Services Include
- Behavioral analytics consulting
- Conversion optimization strategy
- UX analytics implementation
- Growth experimentation frameworks
👉 Ready to understand what your users are really doing?
Book a consultation with Talatech today and transform your analytics into measurable growth.